Output metrics represent outcomes or results and input metrics represent actions. When choosing metrics for your key results, It is important to understand which ones to choose and how they impact your outcomes. There is nothing worse than choosing the wrong metric and spending time optimising it.
What are Output metrics?
Output metrics are the outcomes that you want to ultimately get. These are your North Star metrics. In a business context, they could be things like revenue, the number of paid customers, NPS score, and retention. In sports, they could be the number of goals scored, matches won in a season etc. These metrics usually tell you how your business is doing.
One key characteristic of output metrics is that you cannot directly influence them. Nothing you can do will directly make more money, or score more goals.
What are Input metrics?
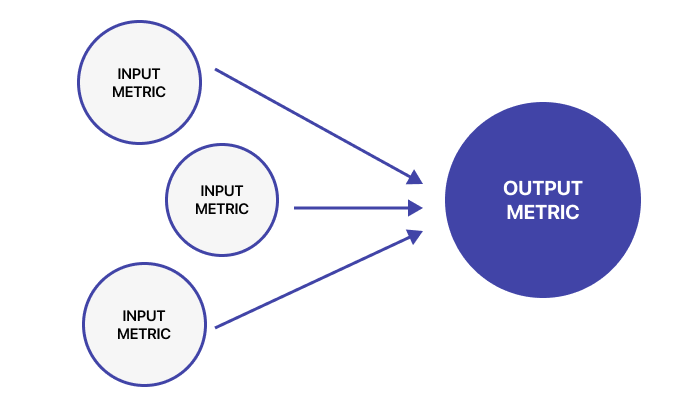
In contrast, Input metrics are the actions you control, in hope that they will impact your output metrics. Good input metrics should be used as checkpoints or milestones to make goals actionable. In a business context, input metrics are things like the number of sales meetings conducted in a month, features built that your customers requested, or time to reply to a support query.
As you can see input metrics are the things that you can directly control.
How to choose Input metrics and Output metrics
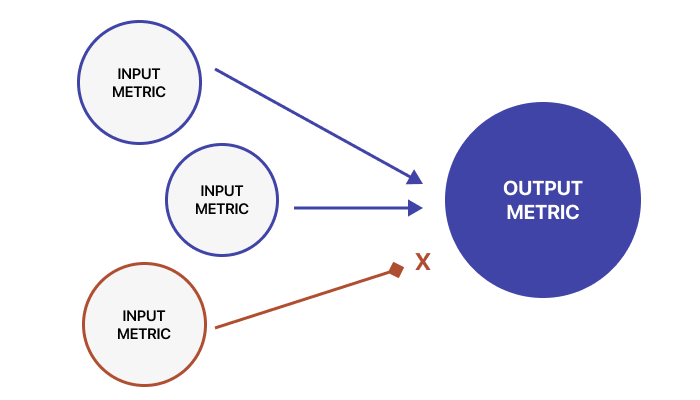
Finding the right input metric is a matter of experimentation. sometimes they are obvious and sometimes not. Finding the highest impact input metric is key to driving a successful outcome.
Examples of Input metrics vs Output metrics
Input metrics →
- These are what you control
- Correlates with your output metric
- for example:
- Users have 7 friends in 10 days
- Users play 10 songs in 1st week
- Number of critical bugs faced
Output metrics
- Output metric is what you finally want
- for example:
- Better retention
- NPS (Net promoter score)
- ARR (Annual recurring revenue)
E-commerce checkout flow
Input metrics →
- Percentage of customers who add items to their cart
- The average number of items added to the cart per customer
- Conversion rate (percentage of customers who complete their purchase)
Output metrics
- Average order value (total revenue generated per transaction) at $100
Marketing team
Marketing Input metrics →
- Write 10 high-quality blog articles
- Publish 5 review videos
Marketing Output metrics
- Generate 1000 leads from the Blog
- Get 50 subscribers on our channel
Sales team
Sales Input metrics →
- No. of Qualified Leads Pipeline
- No. of Meetings Booked
- No. of Trade-shows attended
Sales Output metrics
- 100 closed deals/month
Customer support
Customer support Input metrics →
- First response time
- % of queries closed in 1st response
Customer support Output metrics
- Customer Satisfaction Score (CSAT) Score of 80
Manufacturing
Manufacturing Input metrics →
- Amount of money spent on new equipment and technology
- Number of defects or errors in the manufacturing process
- Number of units produced per hour
Manufacturing Output metrics
- Reduce production costs by 15%
Landing a new Job
Input metrics →
- Apply to 10 Companies
- Land 7 Interviews
- Do 10 Mock Interviews
Output metrics
- 2 confirmed Job Offers

In summary, as you can see in the above examples, choose an input metric you can control, and make it actionable. choose an output metric based on the results you want to achieve. If you only set an output metric, the team will get demotivated easily and will feel like they are shooting in the dark with no visible impact on the final output metric.
Using Input and Output Metrics in your OKRs
A combination of both input and output metrics can be used in good OKRs. Finding good quality input metrics takes time, it is an iterative process. Teams can use correlation analysis to learn about what successful customers are doing in order to achieve the desired outcome and then convert these signals into input metrics.
✨ Goal.new ✨
Try North’s AI-Powered OKR Suggestion tool
Elements of a well-written OKR
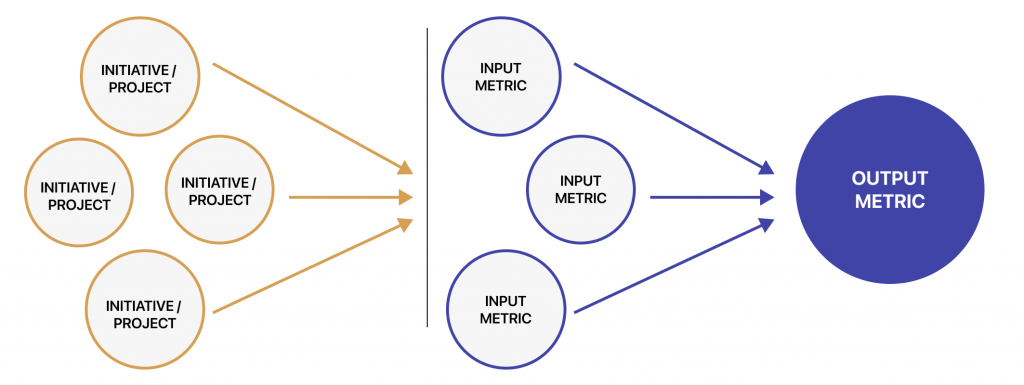
A good OKR consists of both an input metric, output metric and initiative/project:
Input key result:
Input metrics are the things that you can control. these are the metrics when moved, will move the output metrics.
e.g. % users that sent at least 1 invite in week 1
Initiative / Project-based key result:
When a project needs to be completed to achieve the KR and the project will take a significant amount of time and is a prerequisite to the KR. Tracking as a project key result could give the teams good visibility.
Output key result:
Output metrics are the things that you cannot control. these are the metrics you want to ultimately achieve but are not directly in your hand.
e.g. User retention, stock market price, annual recurring revenue (ARR)
An example sales OKR with Input and Output metric
Objective
Grow our global business via expansion in the EU
Key Results
Input KR: Develop a new website + sales pitch (project)
Input KR: Attend 3 trade shows in the region
Input KR: Demo Pitch to 50 customers
Output KR: Bring in $50,000 in bookings by end of Q3
Next:
– Grasp the OKR Meaning
– Learn more about OKR vs KPI
–
North is a single app for Strategy, OKRs, and Initiatives
North is built for data-driven companies that want to make an impact.
Companies of all sizes use North for strategy, goals and Initiatives.
Before you start
What are OKRs?
OKR Meaning
History of OKRs
Benefits of OKRs
Are OKRs right for me?
OKR Mistakes to Avoid
A Brief Guide to OKRs
Aligning with OKRs
Strategic Planning
OKRs in Strategy
SMART, MBO, BHAG
Role of an OKR Champion
Take the OKR Quiz
The North Guide to OKRs
Getting started with OKRs
How North works
A typical OKR Cycle
Planning your OKRs
Weekly OKR Check-In
Stretch vs Committed OKRs
Aligning vs Cascading OKRs
Aligning OKR Teams
OKRs vs KPI
OKR vs KPI: with Examples
Input vs Output metrics
Good and Bad OKRs
OKRs and Agile
OKR Templates
Learning resources
Vision & Mission Templates
Google OKR Template
OKRs for Product teams
OKRs for CEOs’ teams
OKRs for Sales teams
OKRs for Marketing teams
OKRs with Google Workspace
North Features
Getting started with North
Org and Team goals
Goal Initiatives
Goal Check-ins
Give Awards
Goal Alignment
Our take on Product
OKRs for AARRR Metrics
On Product discovery
Communicating well
Metrics for Product teams
Telling stories with data
Data visualisation
✨ Goal.new ✨
Try North’s AI-Powered OKR Suggestion tool
🏔